Dynamo MetricsRegistry — NVIDIA Dynamo Documentation
Title: Dynamo MetricsRegistry — NVIDIA Dynamo Documentation
URL Source: https://docs.nvidia.com/dynamo/latest/observability/metrics.html
Published Time: Fri, 07 Nov 2025 17:51:26 GMT
Markdown Content: Dynamo MetricsRegistry#
Overview#
Dynamo provides built-in metrics capabilities through the MetricsRegistry trait, which is automatically available whenever you use the DistributedRuntime framework. This guide explains how to use metrics for observability and monitoring across all Dynamo components.
Automatic Metrics#
Dynamo automatically exposes metrics with the dynamo_ name prefixes. It also adds the following labels dynamo_namespace, dynamo_component, and dynamo_endpoint to indicate which component is providing the metric.
Frontend Metrics: When using Dynamo HTTP Frontend (--framework VLLM or --framework TRTLLM), these metrics are automatically exposed with the dynamo_frontend_* prefix and include model labels containing the model name. These cover request handling, token processing, and latency measurements. See prometheus-grafana.md for the complete list of frontend metrics.
Component Metrics: The core Dynamo backend system automatically exposes metrics with the dynamo_component_* prefix for all components that use the DistributedRuntime framework. These include request counts, processing times, byte transfers, and system uptime metrics. See prometheus-grafana.md for the complete list of component metrics.
Specialized Component Metrics: Components can also expose additional metrics specific to their functionality. For example, a preprocessor component exposes metrics with the dynamo_preprocessor_* prefix. See prometheus-grafana.md for details on specialized component metrics.
Kubernetes Integration: For comprehensive Kubernetes deployment and monitoring setup, see the Kubernetes Metrics Guide. This includes Prometheus Operator setup, metrics collection configuration, and visualization in Grafana.
Metrics Hierarchy#
The MetricsRegistry trait is implemented by DistributedRuntime, Namespace, Component, and Endpoint, providing a hierarchical approach to metric collection that matches Dynamo’s distributed architecture:
-
DistributedRuntime: Global metrics across the entire runtime -
Namespace: Metrics scoped to a specific dynamo_namespace -
Component: Metrics for a specific dynamo_component within a namespace -
Endpoint: Metrics for individual dynamo_endpoint within a component
This hierarchical structure allows you to create metrics at the appropriate level of granularity for your monitoring needs.
Getting Started#
For a complete setup guide including Docker Compose configuration, Prometheus setup, and Grafana dashboards, see the Getting Started section in the Prometheus and Grafana guide.
The quick start includes:
-
Docker Compose setup for Prometheus and Grafana
-
Pre-configured dashboards and datasources
-
Access URLs for all monitoring endpoints
-
GPU targeting configuration
Implementation Examples#
Examples of creating metrics at different hierarchy levels and using dynamic labels are included in this document below.
Grafana Dashboards#
Use dashboards in deploy/metrics/grafana_dashboards/:
-
grafana-dynamo-dashboard.json: General Dynamo dashboard -
grafana-dcgm-metrics.json: DCGM GPU metrics dashboard
Metrics Visualization Architecture#
Service Topology#
The metrics system follows this architecture for collecting and visualizing metrics:
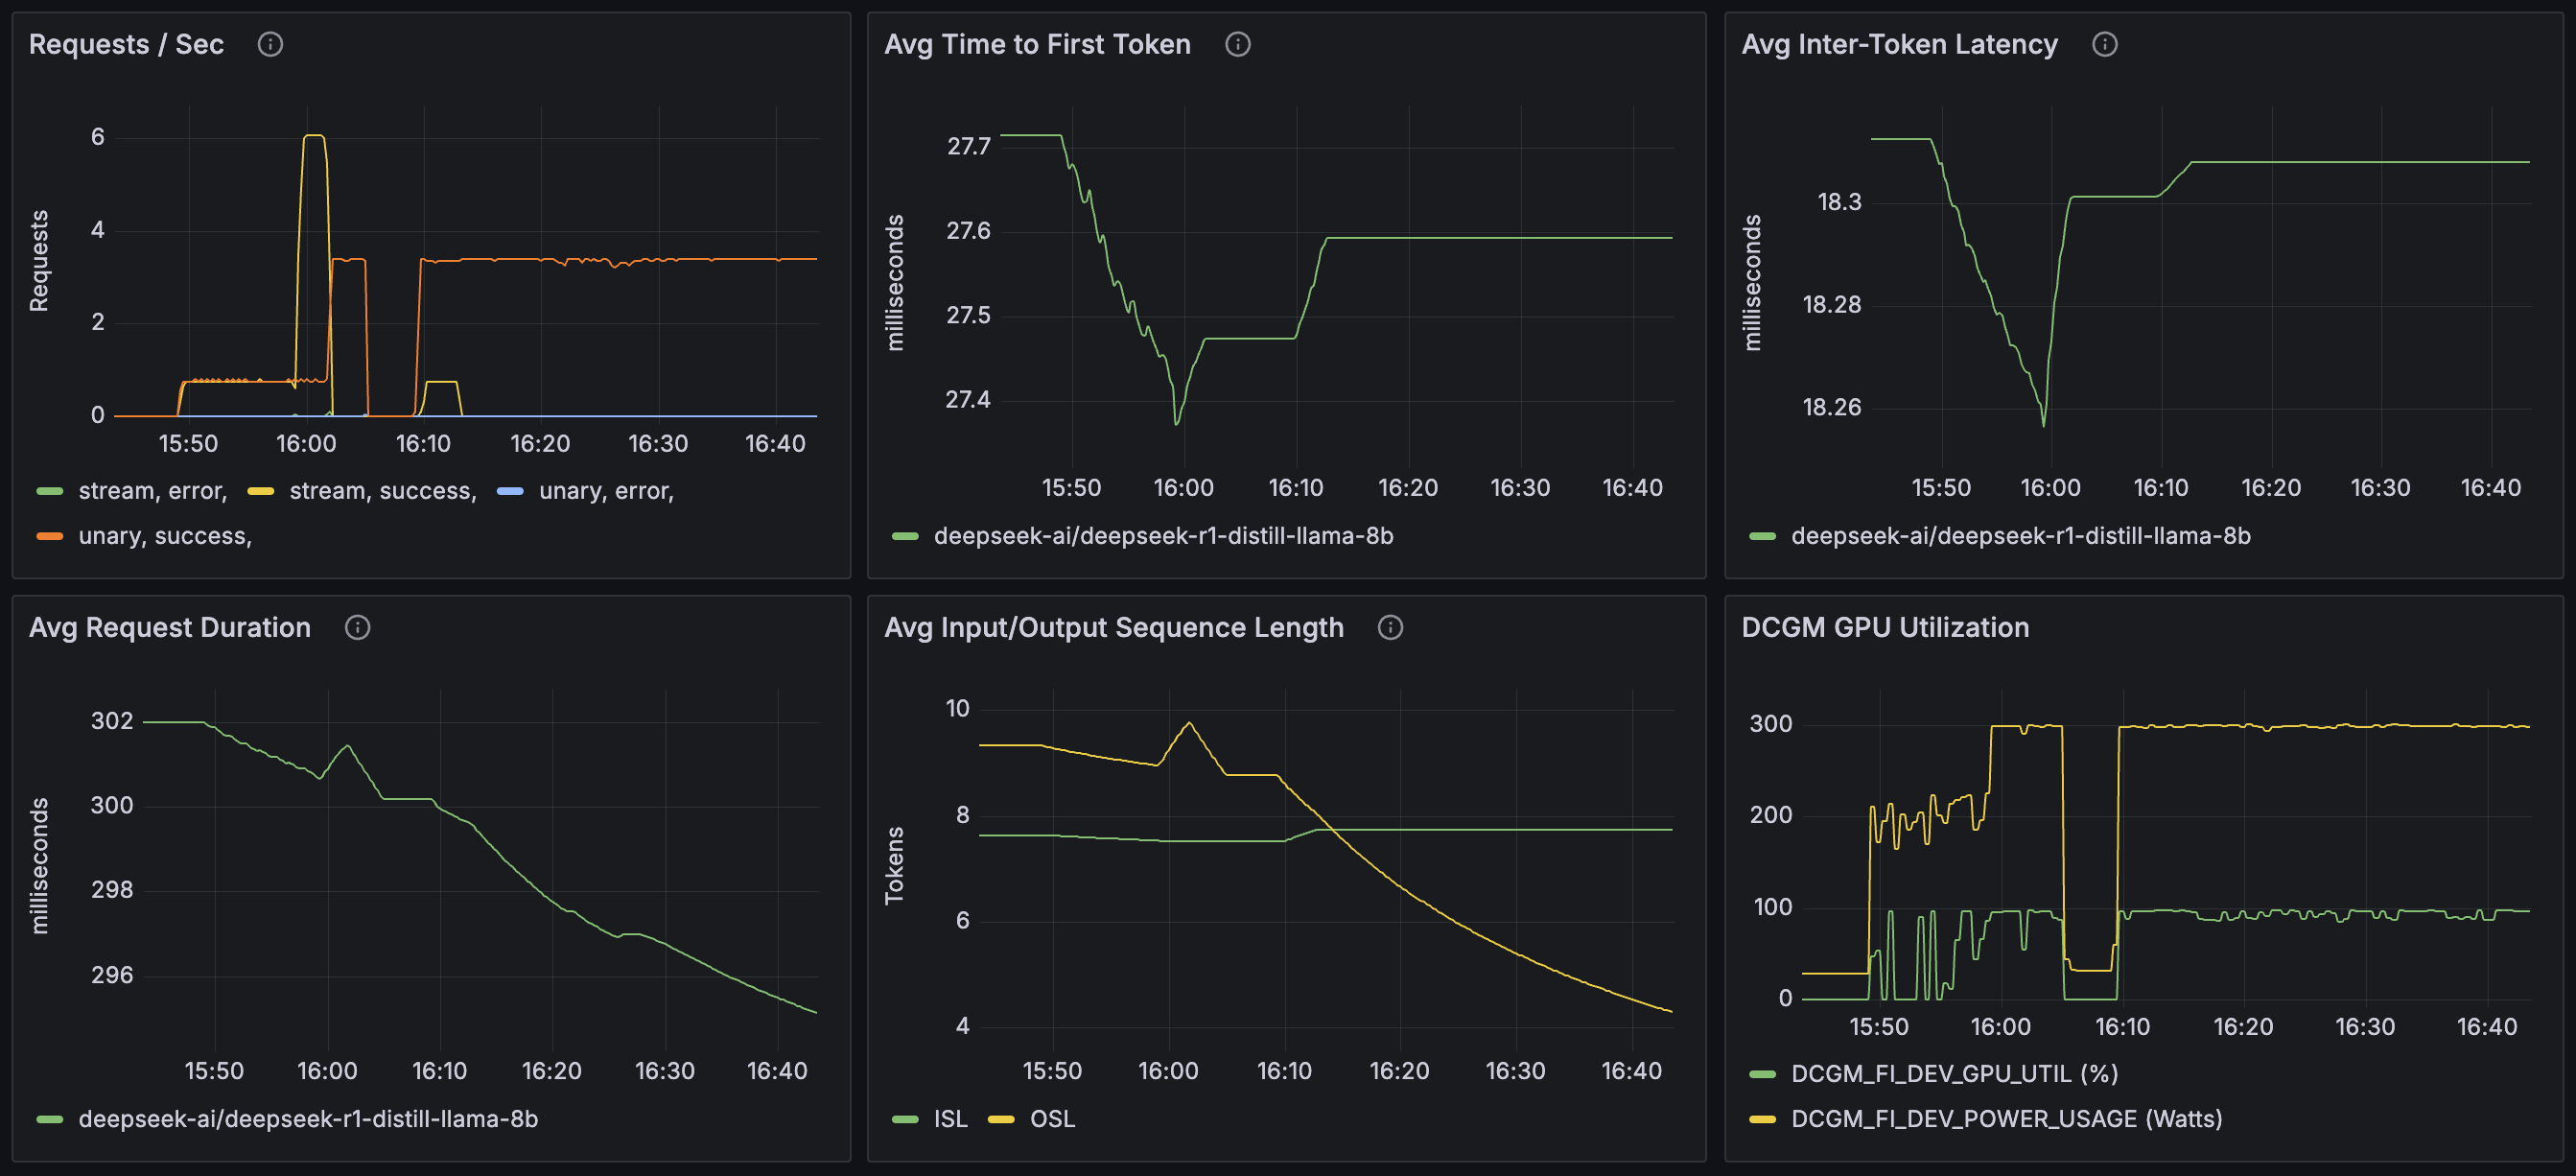
Grafana Dashboard#
The metrics system includes a pre-configured Grafana dashboard for visualizing service metrics:
Detailed Setup Guide#
For complete setup instructions including Docker Compose, Prometheus configuration, and Grafana dashboards, see:
Links/Buttons:
- Skip to main content
- NVIDIA Dynamo Documentation
- latest
- 0.6.1
- 0.6.0
- 0.5.1
- 0.5.0
- 0.4.1
- 0.4.0
- 0.3.2
- 0.3.1
- 0.3.0
- 0.2.1
- 0.2.0
- GitHub
- Installation
- Support Matrix
- Examples
- Deployment Guide
- Kubernetes Quickstart
- Detailed Installation Guide
- Dynamo Operator
- Minikube Setup
- Observability (K8s)
- Metrics
- Logging
- Multinode
- Multinode Deployments
- Grove
- Tool Calling
- Multimodality Support
- Finding Best Initial Configs
- Dynamo Benchmarking Guide
- Tuning Disaggregated Performance
- Writing Python Workers in Dynamo
- Observability (Local)
- Metrics Visualization with Prometheus and Grafana
- Health Checks
- Glossary
- Backends
- vLLM
- SGLang
- TensorRT-LLM
- Router
- Planner
- SLA Planner Quick Start
- SLA-Driven Profiling
- SLA-based Planner
- KVBM
- Motivation
- Architecture
- Components
- Design Deep Dive
- Integrations
- KVBM in vLLM
- KVBM in TRTLLM
- LMCache Integration
- Further Reading
- Overall Architecture
- Architecture Flow
- Disaggregated Serving
- Distributed Runtime
- #
- prometheus-grafana.md
- Getting Started section
- Privacy Policy
- Manage My Privacy
- Do Not Sell or Share My Data
- Terms of Service
- Accessibility
- Corporate Policies
- Product Security
- Contact